
General patterns of adoption
Using the four agroecological stages previously identified to classify local (village-level) conditions in the two study regions and looking at the adoption of Conservation Agriculture by farmers, a new differentiation pattern emerges. As shown in the table below, in 2008, the percent of farmers practicing Conservation Agriculture and the extent of farmland under Conservation Agriculture were indeed significantly higher in villages situated at stages 2 and 4 of the land use intensification process than in villages at stages 1 and 3. During the 2004-2008 period, abandon rates, i.e. the proportion of farmers abandoning Conservation Agriculture after one year of experimentation, were also relatively low for villages at stages 2 and 4.
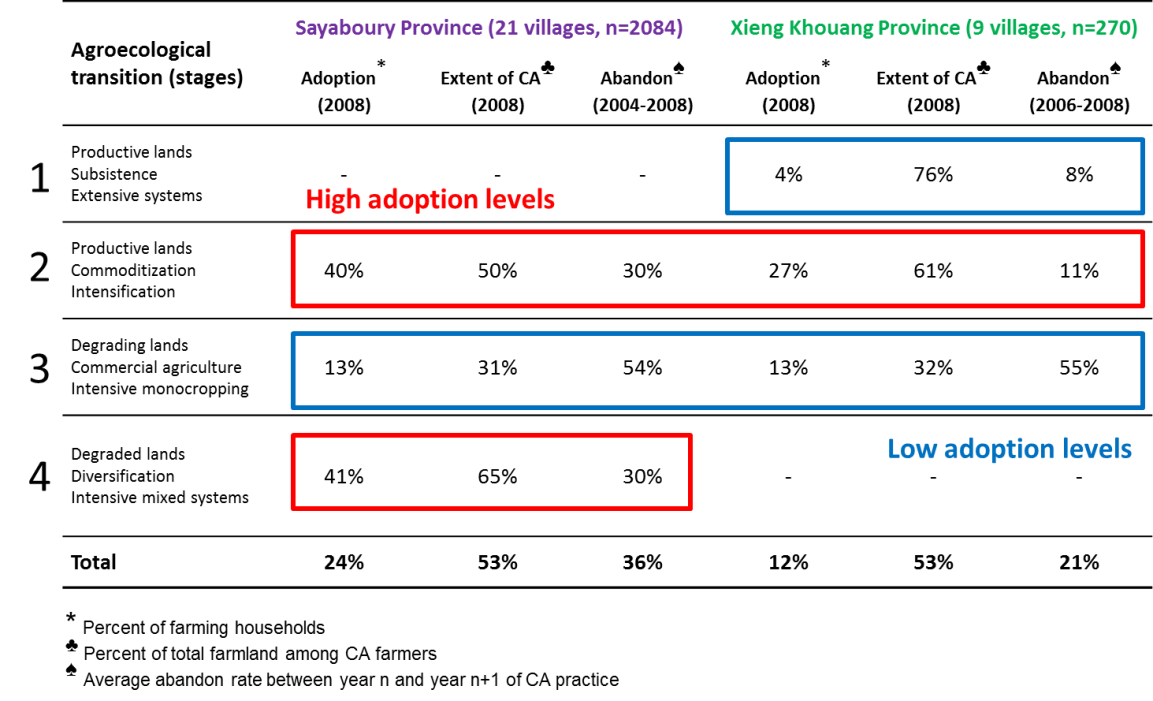
Below, we transpose these observations to the previous diagram representing the four agroecological stages. With very high adoption levels recorded, stages 2 and 4 combine the most promising conditions for the dissemination of Conservation Agriculture. In contrast, adoption levels and the potential for the dissemination of Conservation Agriculture are clearly lower at stage 1 and 3. This differentiation pattern is explained further in the next sections by looking at the DMC systems disseminated in the study regions and their comparative advantages and disadvantages over traditional and conventional practices.


